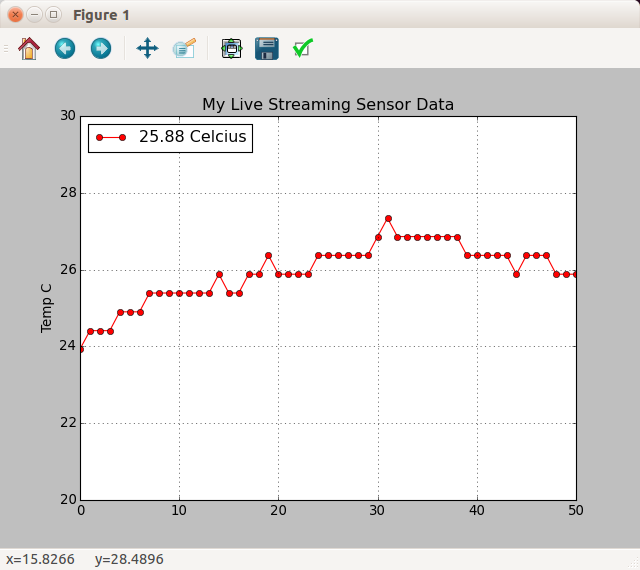
Setelah sebelumnya kita membuat Sensor suhu sederhana Arduino dan koneksi serial data arduino ke Phyton ke php. Kali ini kita mencoba untuk membuat grafik atau plot suhu yang kita dapatkan melalui data serial.
Script yang digunakan untuk arduino tidak kita rubah, namun disarankan untuk menempatkan delay (misal” delay(1000);) agar plot dapat berjalan dengan baik
float temp;
int tempPin = 2;

void setup()
{
Serial.begin(9600);
}

void loop()
{
 temp = analogRead(tempPin);
 temp = temp * 0.48828125; //(5V * 100C)/1024
 Serial.print("TEMPERATURE = ");
 Serial.print(temp);
 Serial.print("*C");
 Serial.println();
 delay(1000);
}
Sedangkan untuk display grafik plot dengan koneksi serial kita menggunakan pemograman python dengan script sebagai berikut:
import serial # import Serial Library
import numpy  # Import numpy
import matplotlib.pyplot as plt #import matplotlib library
from drawnow import *

tempF= []
arduinoData = serial.Serial('/dev/ttyACM0', 9600) #Creating our serial object named arduinoData
plt.ion() #Tell matplotlib you want interactive mode to plot live data
cnt=0

def makeFig(): #Create a function that makes our desired plot
    plt.ylim(int(temp)-5,int(temp)+5)                                 #Set y min and max values
    plt.title('My Live Streaming Sensor Data')      #Plot the title
    plt.grid(True)                                  #Turn the grid on
    plt.ylabel('Temp C')                            #Set ylabels
    plt.plot(tempF, 'ro-', label= str(temp) + ' Celcius')       #plot the temperature
    plt.legend(loc='upper left')                    #plot the legend


while True: # While loop that loops forever
    while (arduinoData.inWaiting()==0): #Wait here until there is data
        pass #do nothing
    arduinoString = arduinoData.readline() #read the line of text from the serial port
    kata2=arduinoString.rsplit(None,3)[2]
    dataArray = kata2.split('*')
    temp = float( dataArray[0])            #Convert first element to floating number and put in temp
    tempF.append(temp)                     #Build our tempF array by appending temp readings
    drawnow(makeFig)                       #Call drawnow to update our live graph
    plt.pause(.000001)                     #Pause Briefly. Important to keep drawnow from crashing
    cnt=cnt+1
    if(cnt>50):                            #If you have 50 or more points, delete the first one from the array
        tempF.pop(0)                       #This allows us to just see the last 50 data point
hasil grafik yang kita dapatkan sebagai berikut:

